Dashboard Overview
Your dashboard is the central hub of the MHS Partner Portal. This guide will help you understand all the information and features available on your main dashboard.
Dashboard Layout
The dashboard is organized into several key sections:
Welcome Header - Personal greeting and refresh controls
Key Metrics - Quick overview of your account status
Recent Activity - Your latest actions and orders
Quick Actions - Shortcuts to common tasks
Account Summary - Account status and information
System Status - Portal health and availability
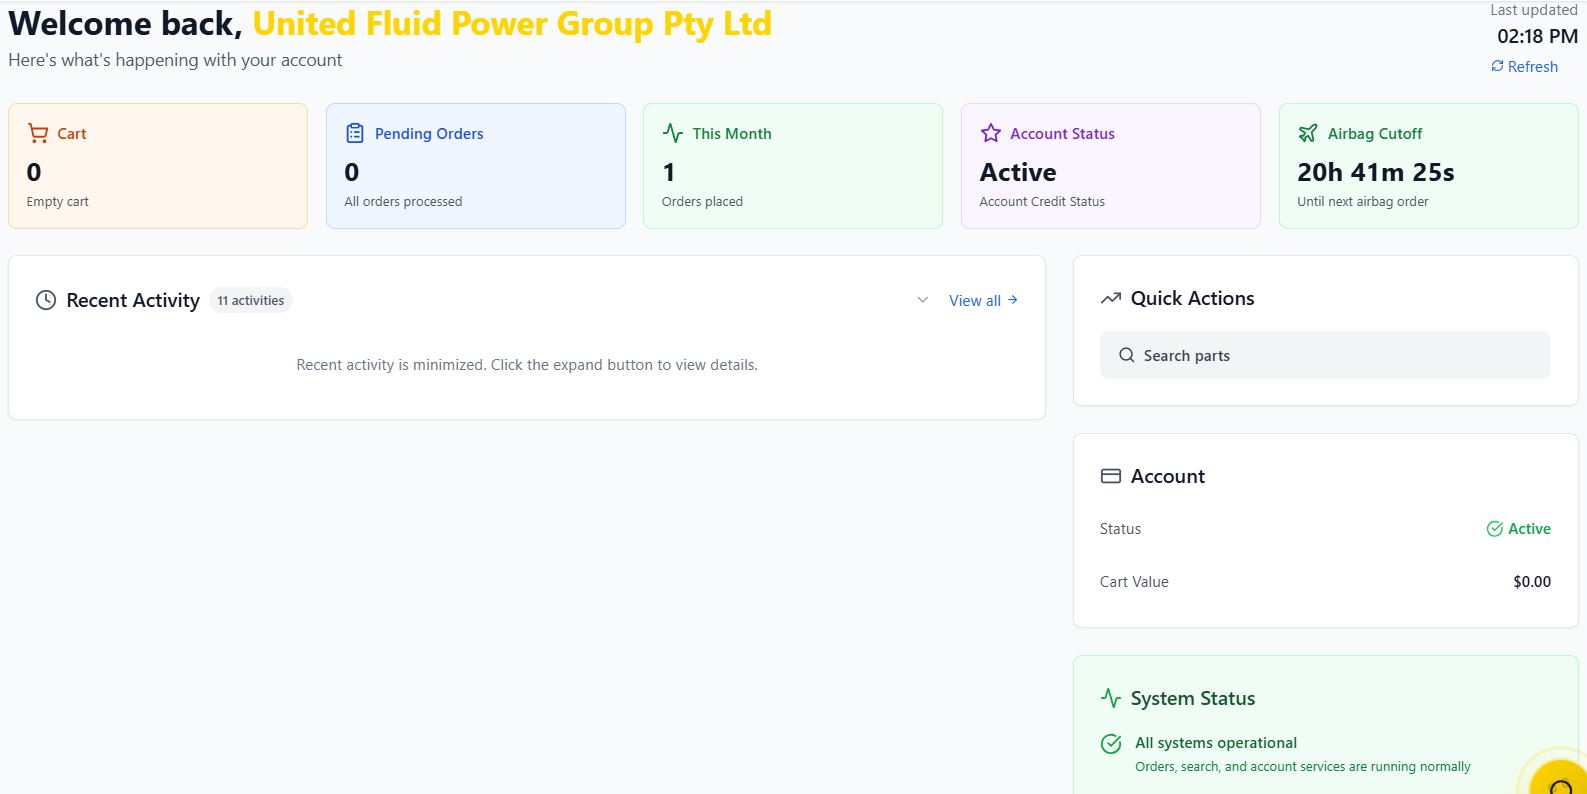
Welcome Header
At the top of your dashboard:
Personal greeting with your company name
Last updated time showing when data was refreshed
Refresh button to manually update all dashboard data
Key Metrics Cards

Five metric cards provide instant insights:
- Cart Status
Number of items in your cart
Total cart value
Click to view your cart
- Pending Orders
Orders awaiting processing or approval
Quick access to order management
Click to view pending orders
- This Month’s Orders
Count of orders placed this month
Helps track monthly activity
Click to view order history
- Account Status
Current account standing
Credit status indicator
Click to view account details
- Airbag Cutoff Timer
Countdown to next airbag order deadline
Shows time remaining until 11 AM cutoff
Important for time-sensitive orders
Note
Airbag orders must be placed before 11 AM on weekdays. The countdown helps you track this important deadline.
Recent Activity Feed
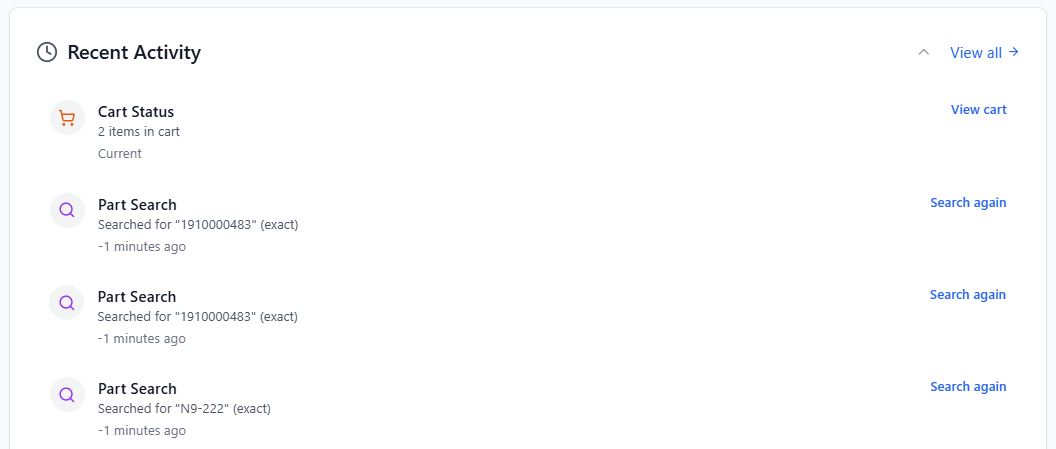
The activity feed shows your recent actions:
- Order Updates
New orders placed
Status changes (processing, approved, completed)
Order numbers and timestamps
- Search History
Recent part searches
Search types (exact, fuzzy, description)
Click to search again
- Favorites Activity
Parts added to favorites
Quick access to search favorites
- Cart Activity
Current cart status
Number of items waiting
- Minimizing Activity Feed
Click the minimize button to hide details
Preference is saved for future visits
Shows item count when minimized
Quick Actions Panel
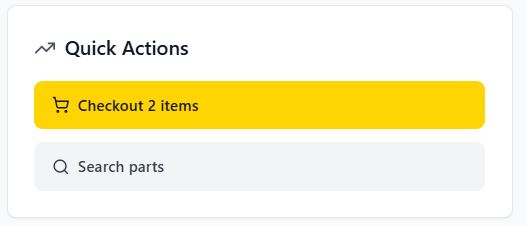
Dynamic shortcuts based on your current state:
- Context-Aware Actions
If you have cart items: “Checkout X items”
If you have recent orders: “Reorder from recent”
Always available: “Search parts”
- Action Types
Primary actions (yellow buttons) - most important
Secondary actions (gray buttons) - supporting tasks
Account Summary
Shows important account information:
- Account Status
Active/inactive indicator
Account type and permissions
Credit standing
- Cart Value
Current total in your cart
Updated in real-time
- Admin/Staff Access
Quick link to admin panel (if applicable)
Staff area access (if applicable)
System Status Monitor

Real-time system health information:
- Overall Status
Green: All systems operational
Yellow: Performance degraded
Red: System issues detected
Gray: Status unknown
- Component Health
Backend server status
Frontend application status
Proxy server status
Gateway status
- Status Page Link
Access detailed system status
View maintenance schedules
Check for known issues
Using the Dashboard Effectively
- Daily Workflow
Check pending orders and cart status
Review recent activity for updates
Use quick actions for common tasks
Monitor system status for any issues
- Weekly Review
Check monthly order metrics
Review search history for patterns
Update favorites as needed
- Troubleshooting
System status provides first-line diagnostics
Activity feed helps track recent actions
Metric cards highlight potential issues
Dashboard Tips
- Efficiency Tips
Use quick actions for faster navigation
Minimize activity feed if you prefer more space
Bookmark frequently used features
- Monitoring
Watch the airbag countdown for time-sensitive orders
Check pending orders regularly
Monitor system status before placing large orders
- Customization
Activity feed minimize state is remembered
Quick actions adapt to your usage patterns
Notification preferences affect dashboard updates
Mobile Dashboard
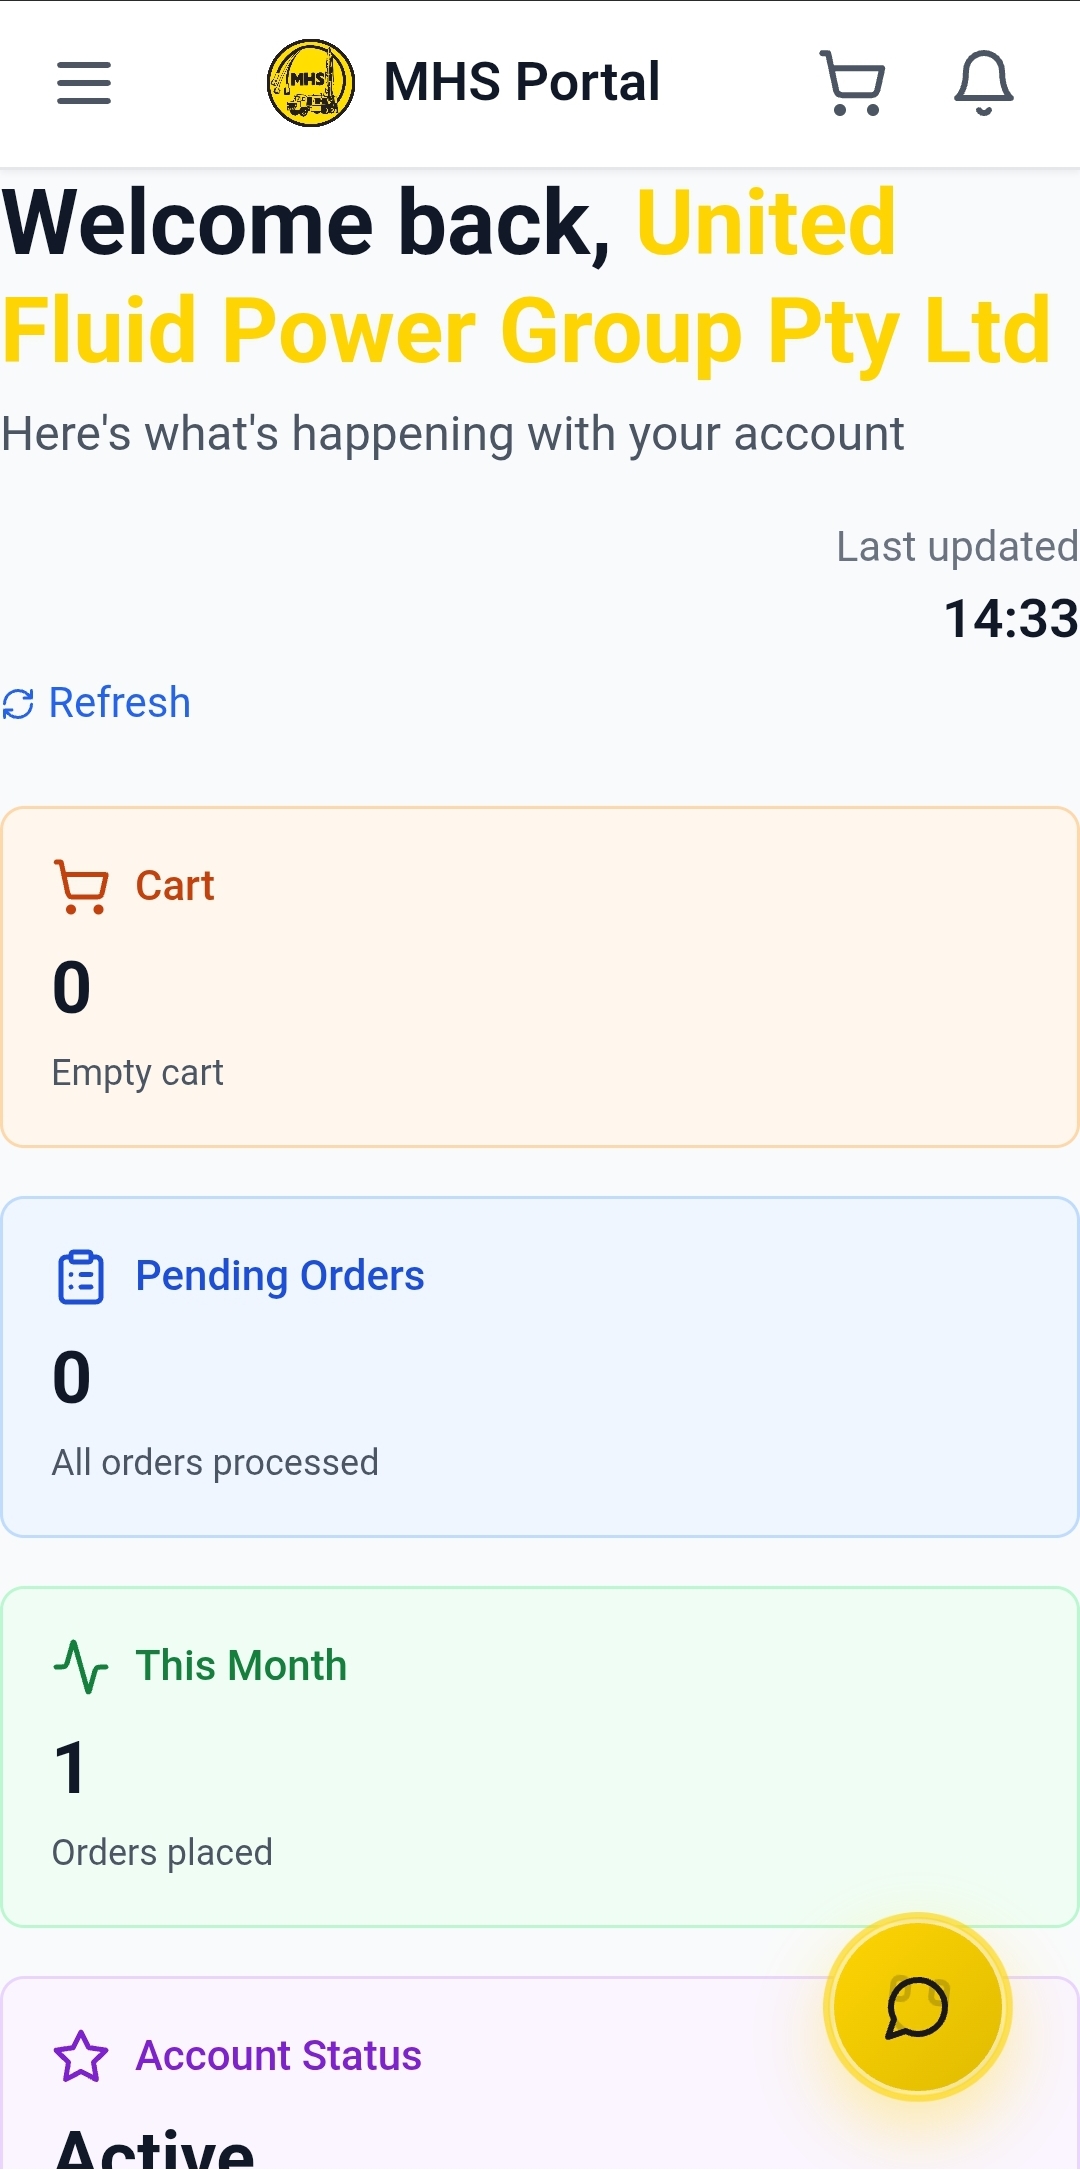
On mobile devices, the dashboard:
Stacks vertically for easy scrolling
Maintains all functionality in a touch-friendly layout
Prioritizes key metrics at the top
Provides quick access to essential features
Refreshing Data
Dashboard data updates:
Automatically when you navigate back to the dashboard
Manually using the refresh button
Real-time for cart and system status
Periodically for order and activity data
Tip
Click the refresh button if you think your data might be outdated, especially after making changes in other parts of the portal.
Next Steps
Now that you understand your dashboard:
Basic Search - Learn to search for parts
Adding Items to Cart - Start building your first order
Favorites Management - Set up your favorite parts
Bulk Upload and Ordering - Learn about bulk ordering